Metrics
Metrics let you track how Watchtower behaves over time — scan cadence, registry reliability, security-relevant events, and per-container watch status.
To use this feature, enable the metrics API,
set an API token (or opt out via
--http-api-metrics-no-auth for
trusted networks), and map port 8080 from the container.
The endpoint is GET /v1/metrics, served in Prometheus exposition format.
Scrape configuration
scrape_configs:
  - job_name: watchtower
    scrape_interval: 30s
    metrics_path: /v1/metrics
    bearer_token: demotoken
    static_configs:
      - targets:
          - 'watchtower:8080'
Replace demotoken with the token you set via --http-api-token. Drop the
bearer_token line entirely if --http-api-metrics-no-auth is active.
For homelab cadences (polls every minutes-to-hours), scrape_interval: 30s
is plenty. Tighter intervals don't help because the underlying gauges only
change once per scan.
Available metrics
Grouped by what they tell you.
Scan cycle
| Metric | Type | What it tells you |
|---|---|---|
watchtower_scans_total |
counter | Poll cycles since the daemon started. rate() gives you scans-per-second. |
watchtower_scans_skipped |
counter | Cycles where another update was still in flight. Non-zero suggests an HTTP API request is racing the scheduler or the update is stuck. |
watchtower_containers_scanned |
gauge | Containers inspected during the last scan. |
watchtower_containers_updated |
gauge | Containers recreated during the last scan. |
watchtower_containers_failed |
gauge | Containers whose update failed during the last scan. |
watchtower_last_scan_timestamp_seconds |
gauge | Unix timestamp of the most recent completed scan. Pair with time() for staleness alerts. |
watchtower_poll_interval_seconds |
gauge | Configured cadence between scans, derived from the active schedule at startup. Scale alert thresholds by this instead of hardcoding a window. |
watchtower_poll_duration_seconds |
histogram | Wall-clock duration of each scan + update cycle. Buckets from 0.5s to 5m. Use histogram_quantile(0.95, ...) for p95. |
Watch status
Published every scan regardless of whether any audit flag is set.
| Metric | Type | What it tells you |
|---|---|---|
watchtower_containers_managed |
gauge | Containers with com.centurylinklabs.watchtower.enable=true. |
watchtower_containers_excluded |
gauge | Containers with com.centurylinklabs.watchtower.enable=false (intentional opt-out). |
watchtower_containers_unmanaged |
gauge | Containers with no enable label at all. Under --label-enable these are silently skipped — hit /v1/audit for names or enable --audit-unmanaged for log warnings. Excludes Docker-managed infrastructure (buildkit etc.), which is tracked separately in watchtower_containers_infrastructure. |
watchtower_containers_infrastructure |
gauge | Docker-managed scaffolding (moby/buildkit* image prefix, docker/desktop-* image prefix, com.docker.buildx.* / com.docker.desktop.* label prefixes). Not a user workload; tracked separately so transient builder containers don't show up as unmanaged noise. |
Update lifecycle
| Metric | Type | What it tells you |
|---|---|---|
watchtower_rollbacks_total |
counter | Rollbacks triggered by --health-check-gated. Each increment = a replacement container failed health check and the previous image was restored. |
watchtower_promotion_aborts_total |
counter | Blue-green cutovers that brought up a healthy replacement ("green") but could not retire the old container. Unlike a rollback the new image is live — green keeps a temporary name and the old container lingers — so it is counted separately from watchtower_rollbacks_total. Non-zero means a cutover needs manual reconciliation: docker compose up -d --force-recreate <service>. |
watchtower_stranded_init_deps_total |
counter | Times --rerun-init-deps found a stale Compose-managed target with no declared service_completed_successfully deps while its project still held one-shot init siblings (migrate/pg-ready) — the signature of a com.docker.compose.depends_on label dropped by a prior blue-green cutover. Non-zero means a service may be running new code against an un-migrated schema; redeploy it via docker compose up -d --force-recreate <service> to restore the label. Suppress a legitimate no-init-deps service with the com.centurylinklabs.watchtower.no-init-deps=true label. |
watchtower_containers_in_cooldown |
gauge | Containers currently waiting out a --image-cooldown window. Non-zero right after a fresh push; stuck non-zero means the author keeps re-pushing and resetting the clock. |
watchtower_image_fallback_total |
counter | Times GetContainer fell back to inspecting by image reference because the source image ID was missing locally. Sustained counts indicate external tooling is deleting images Watchtower still needs. Background: upstream#1217. |
HTTP API (/v1/* endpoints)
| Metric | Labels | What it tells you |
|---|---|---|
watchtower_api_requests_total |
endpoint, status |
One counter per endpoint and response status code. A burst of status="401" on endpoint="/v1/update" is usually credential stuffing. |
Registry traffic
| Metric | Labels | What it tells you |
|---|---|---|
watchtower_registry_requests_total |
host, operation, outcome |
Outbound requests to registries. Operations are challenge, token, digest_head, digest_get; outcomes are success, error, retried. digest_head failures followed by digest_get successes are expected for registries that reject HEAD on manifests. |
watchtower_registry_retries_total |
host |
Bounded-backoff retry attempts. Zero is healthy; sustained non-zero means a flaky registry. |
watchtower_auth_cache_hits_total |
— | Bearer-token cache hits. High rate means the in-memory cache is sparing the oauth endpoint. |
watchtower_auth_cache_misses_total |
— | Cache misses — each miss triggers an oauth exchange. |
Docker daemon
| Metric | Labels | What it tells you |
|---|---|---|
watchtower_docker_api_errors_total |
operation |
Errors from the Docker engine API, broken down by operation. Operations: list, inspect, kill, start, create, remove, image_inspect, image_remove, image_pull, rename, network_connect, network_disconnect, events. Sustained non-zero rates usually mean socket permission issues or a daemon under load. |
watchtower_docker_api_retries_total |
operation |
Retry attempts against the Docker engine API after a transient failure (daemon restart, socket blip, engine 5xx). One increment per retry attempt, not per failed call. Currently emitted for operation="list". Zero is healthy; a rising counter points at a flaky daemon. |
Docker event stream (--watch-docker-events)
Emitted only when the event watcher is enabled. Flat zeros on all three are expected if the flag is off.
| Metric | Labels | What it tells you |
|---|---|---|
watchtower_events_received_total |
action |
Docker engine events consumed from the stream, split by action (tag, load). Correlates with local docker build / docker load activity. |
watchtower_events_triggered_scans_total |
— | Debounced scans actually fired. Always ≤ watchtower_events_received_total — a multi-layer build collapses into a single scan. |
watchtower_events_reconnects_total |
— | Times the event stream was re-established after a transport error. Occasional ticks are normal (daemon restart, network blip); a rapidly climbing counter means the stream is flapping — pair with watchtower_docker_api_errors_total{operation="events"} to see the cause. |
Useful queries
Staleness: time() - watchtower_last_scan_timestamp_seconds — seconds since the last scan.
p95 scan duration: histogram_quantile(0.95, sum by (le) (rate(watchtower_poll_duration_seconds_bucket[5m]))).
Bearer-cache hit ratio:
sum(increase(watchtower_auth_cache_hits_total[1h])) / clamp_min(sum(increase(watchtower_auth_cache_hits_total[1h])) + sum(increase(watchtower_auth_cache_misses_total[1h])), 1).
Unmanaged containers present for > 1 h: watchtower_containers_unmanaged > 0 with an alert for: 1h.
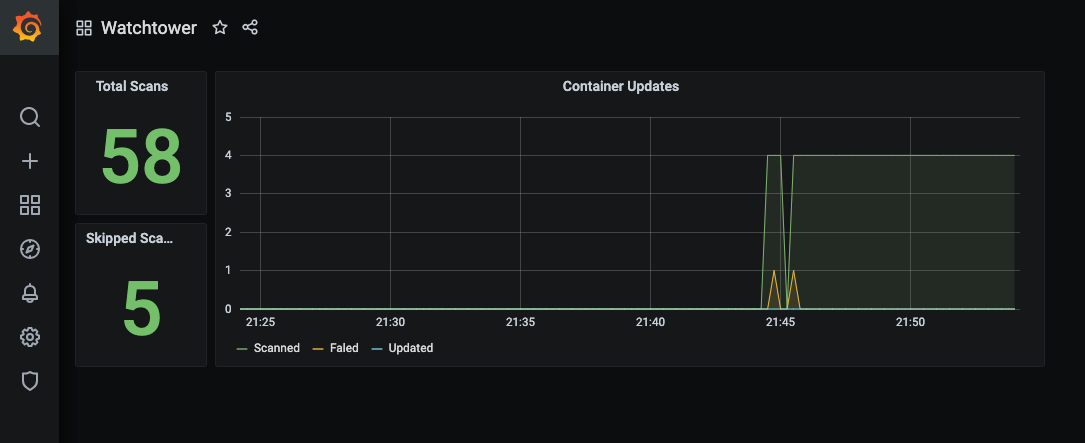
Dashboards and alerts
Ready-to-import Grafana dashboard and Prometheus alerting rules ship under
observability/
in the source tree. Dashboard covers the three rows above (overview, watch
status, reliability + security), plus three annotation tracks for rollbacks,
daemon restarts, and newly-appeared unmanaged containers.
Demo
The repository contains a demo with Prometheus and Grafana, available via
docker-compose.yml. This demo is preconfigured with the dashboard: